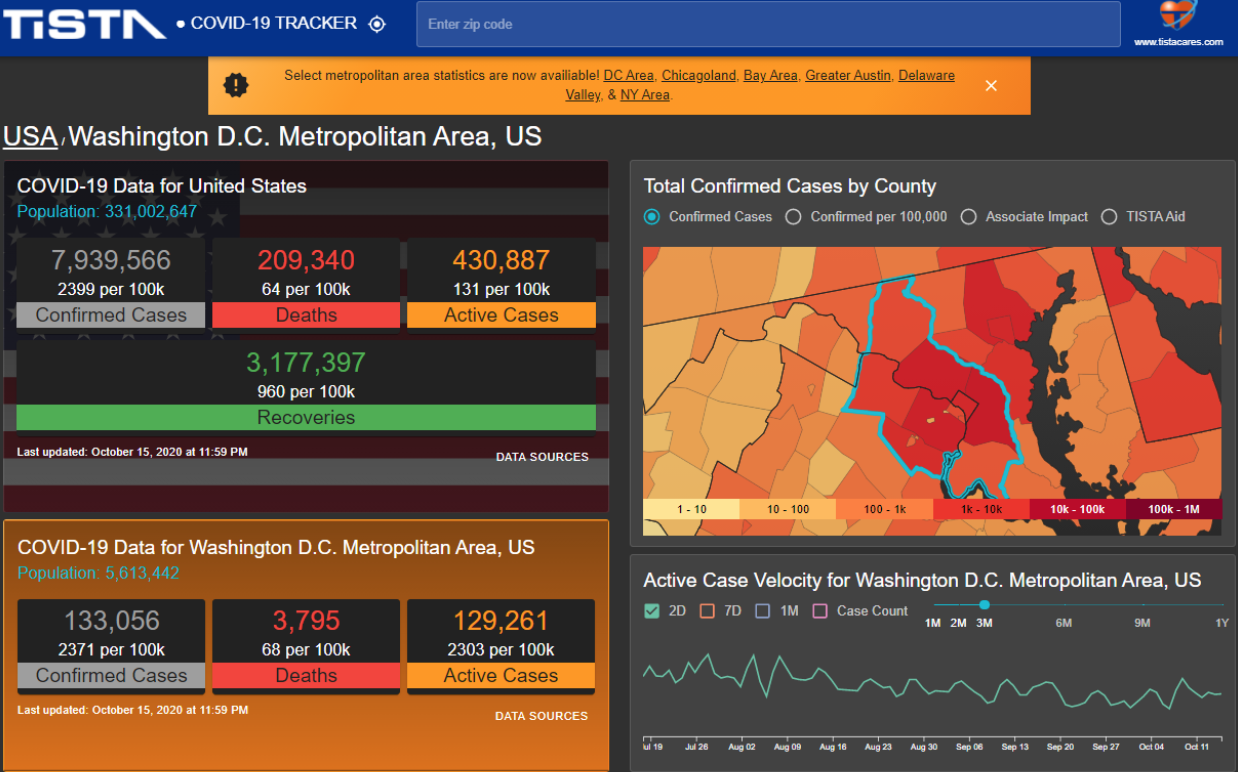
Today brings a new update to TISTA’s COVID-19 Tracker application. The app works on any desktop or mobile device and makes it easy for users to track and visualize pandemic data at the national, state, and local level.
Metropolitan Area Views
Washington, D.C., New York City, Philadelphia, Austin, Chicago, and San Fransisco now all support a view for the surrounding metropolitan areas. The next time you visit the site, you’ll see a golden banner explaining the new feature.
![]()
Also, when searching by zip code, any matching area will be shown at the top of the results. Look for the icon and the golden color.
![]()
Additionally, when viewing a county included in a metro area, a golden button will direct you to the metro area view:
![]()
Metro area views have all of the same information as the county views: maps, timelines, and case statistics.

Finally, you can add a metro area view to your “My Locations” table and compare it to your other saved areas.

Timeline Controls
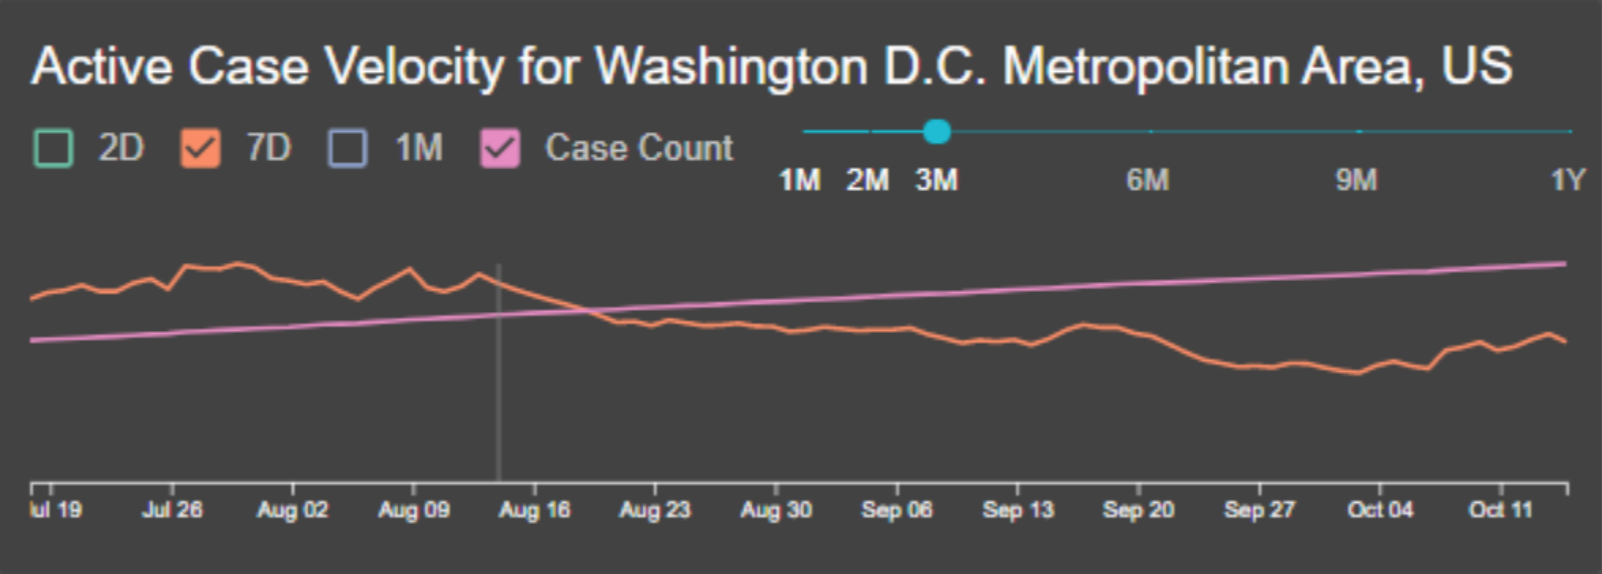
As an update to the Active Case Velocity graph, there is now the option to change how far back to view the data. The view defaults to the last three months, but you can simply adjust the slider and change the displayed timespan.


